

If you are waiting for the Toronto housing market to completely crash, May's data just threw a massive wrench in that plan. While average prices are down slightly, buyers actually stepped up the pace, pushing total sales up over 6% compared to May of last year. At the same time, sellers held back, causing new listings to plummet by nearly 19%. This shift means the broad crash many anticipated has not materialized, though market directions depend heavily on whether you look at detached homes or downtown condos.
Understanding these dynamics requires looking closely at local numbers across the city. Broad regional statistics fail to tell the true story because real estate is extremely local. Here is the exact data you need to know if you plan to sell your home or contemplate buying a property this summer.
Analyzing the Overall Toronto Regional Real Estate Market
The Toronto Regional Real Estate Board covers a very wide geographic area. To be exact, the board tracks seven regions in total, which creates a highly diverse statistical mix. For our focus, we are narrowing the data down to the city of Toronto only, specifically looking at detached houses, semi-detached houses, and the condo market.
Across the broader region, sales went up by 6.3% in May of 2026 compared to May of 2025. This increase brought the total number of sales to just over 6,500. While a 6% increase sounds good on paper, we have to look at the broader picture regarding the new supply of properties coming onto the market. New listings dropped by approximately 19% during the month of May.
Sellers, whether they are home sellers, investment property sellers, or condo sellers, have held back. They are choosing not to list their properties, likely because they understand current market conditions will not net them the specific number they are looking for. Consequently, active listings dropped by 13.3% across the board.
The average price in the whole region dropped by 4.6%, though I do not put too much weight into that figure. Because it takes all seven regions into account, it obscures the reality of local neighborhoods. Meanwhile, listing days on market went up from 25 to 27 days. Property days on market, which includes all cancellations and relistings, rose from 39 to 42 days, proving it is still taking longer to sell a property.
The High Level Historical Perspective
Although sales in the month of May reached 6,583, they are still 23% below the 10-year average of 8,501 for the month of May. This fact is important to keep in mind because this tracking period represents the third lowest sales year in those 10 years.
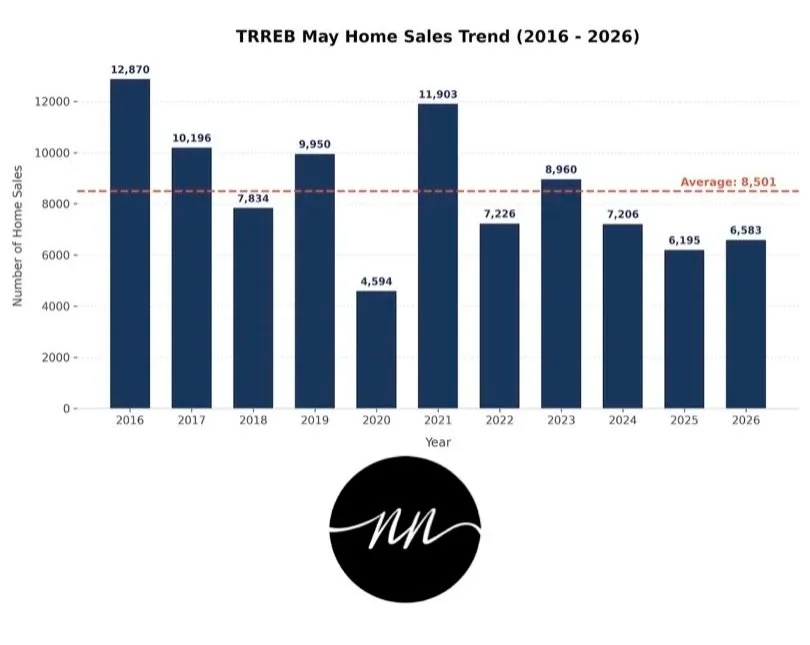
If we remove May of 2020 from the data, which was when the whole world was shut down, May 2026 actually represents the second worst sales volume over the last 10 years. The year 2025 brought the lowest sales in over 25 years. While activity improved this year, staying 23% below the 10-year historical average shows that the market is still operating at a slower historical pace.
City of Toronto Breakdown by Property Type
When we isolate the 416 area code to look at the city of Toronto only, we see distinct patterns by property type:
Detached home sales were up 8.9% compared to May of 2025.
Semi-detached home sales increased by 2.5% over last year.
Condo market sales rose by 4.2% year over year.
Having said that, average prices went down across the city. In the city of Toronto, detached average prices fell 6.5%, while semi-detached prices remained flat with a minor negative 0.6% change. Condo average prices were down 5% compared to May of 2025.
The Freehold Market: Detached and Semi-Detached Homes
The detached property segment currently shows 3.27 months of inventory. In real estate terms, between four and six months of inventory is considered a balanced market. Anything under four months tips directly into sellers' territory, while anything over six months gives buyers the distinct advantage.
Currently, 31 out of every 100 detached homes listed are selling. The average price for a detached home in the city stands at 1.6 million dollars, with a median price of 1.3 million dollars. The 8.9% increase in sales shows that buyer demand for detached properties remains stable despite pricing adjustments.
The Competitive Semi-Detached Segment
With respect to semi-detached properties, inventory is much lower, meaning there is less product to choose from overall in the city of Toronto. The segment sits tight at 1.84 months of inventory, and 54 out of 100 semi-detached homes sold in the month of May. The average price is $1,293,000, with a median price of $1,119,000.
Semi-detached homes represent a major transition point for buyers moving from the condo market to detached properties. They offer young families a practical option with no condo fees, ground-level housing, front driveway parking in some cases, and a decent backyard for the kids to play in.
Inside the Toronto Condo Market: Understanding the Three Sub-Markets
The condo market presents a completely different landscape. The official months of inventory sits at 5.44 months. Although this technically registers as a balanced market because it falls between four and six months, it is actually still heavily in the buyer's favor.
The average price for a city condo is $673,000, with a median price of $565,000, even as sales increased by 4.2%. To understand why buyers hold the upper hand, you have to look beyond the standard MLS data. There are actually three distinct condo markets competing with one another right now.
1. The Resale MLS Market
This is the traditional market where individual condo owners place their properties up for sale. It is the most visible market, but it only represents one layer of available supply.
2. The Builder Supply Market
Developers are sitting on finished, unsold units that they are highly motivated to move. Builder sales have increased due to government incentives, specifically the HST rebate or waiver of up to 130,000 dollars. Builders can offer this significant financial incentive to individual buyers, creating fierce competition for resale sellers.
3. The Assignment Market
The assignment market consists of pre-construction buyers who purchased condos years ago. As these buildings near completion, these buyers face taking title and closing on the properties. Those who cannot close are desperately trying to assign their contracts before final completion.
The HST rebate heavily penalizes the assignment market because that $130,000 waiver is not applicable to an assignment sale. This limitation puts further downward pressure on assignment sellers, leaving buyers with a massive amount of supply, numerous options, and the upper hand in negotiations.
A Closer Look at the Downtown Condo Core: C1 vs C8
To understand the core condo market, we look at the specific real estate zones C1 and C8. The C1 zone runs from Yonge Street to Dufferin Street, from Bloor Street down to the lake. The C8 zone runs from Yonge Street east to the DVP, from Bloor Street down to the lake.
Data shows there are significantly more condos and higher sales volumes west of Yonge Street:
Sales Volume: C1 (West of Yonge) had 253 sales, while C8 (East of Yonge) had 131 sales.
Active Listings: C1 finished May with 1,863 active listings, compared to 793 active listings in C8.
Average Price: The average price is higher west of Yonge at 737,000 dollars, compared to 631,000 dollars east of Yonge.
For buyers, the east side of Yonge Street provides a more affordable entry point into downtown living, even though there are fewer total options available.
When reviewing these figures, do not put too much weight on the sales-to-listing-price ratio, which sits at roughly 97%. This ratio only reflects the final list price. If a seller lists at $800,000, terminates, relists at $750,000, terminates again, and finally lists and sells at $700,000, the ratio only compares the $700,000 sale price to the last list price. It does not reflect the true pricing journey of that property. Condos in the core average 30 to 33 days on market for their final listing, though the total process often takes several months.
Strategic Advice for Buyers and Sellers This Summer
If you are a seller navigating the detached or semi-detached market, conditions are gradually shifting toward your advantage. Depending on your specific location and how well your house shows, you could face multiple offers and active competition from buyers.
If you are a buyer looking to acquire freehold, ground-level housing, recognize that inventory is shrinking and choice is becoming limited by neighbourhood. If you financially qualify, possess secure employment, and have been sitting on the sidelines, take advantage of the current market to buy your long-term home. Plan to live in that specific property for at least seven years.
For condo sellers, you must stay one or two steps ahead of the market trend. Review what has sold and what has been terminated over the past 30 days, and adjust your pricing to meet where buyers will realistically be 30 to 45 days from now.
Condo buyers should recognize they have immense leverage. Negotiate hard, secure your target price, and include all necessary conditions. When shopping, prioritize a functional floor plan layout. Excellent layouts make a massive difference in daily living and will heavily impact your resale value down the line.
If you want to discuss your specific situation reach out.

Click Here For Video